Find out what your data maturity level is
Data matures like wine - terribly if you keep it in the wrong conditions. To be precise, the organization owning the data should evolve from mere storage to analysis and optimization, from there to a build-measure-learn loop and, finally, to predicting the future through data science.
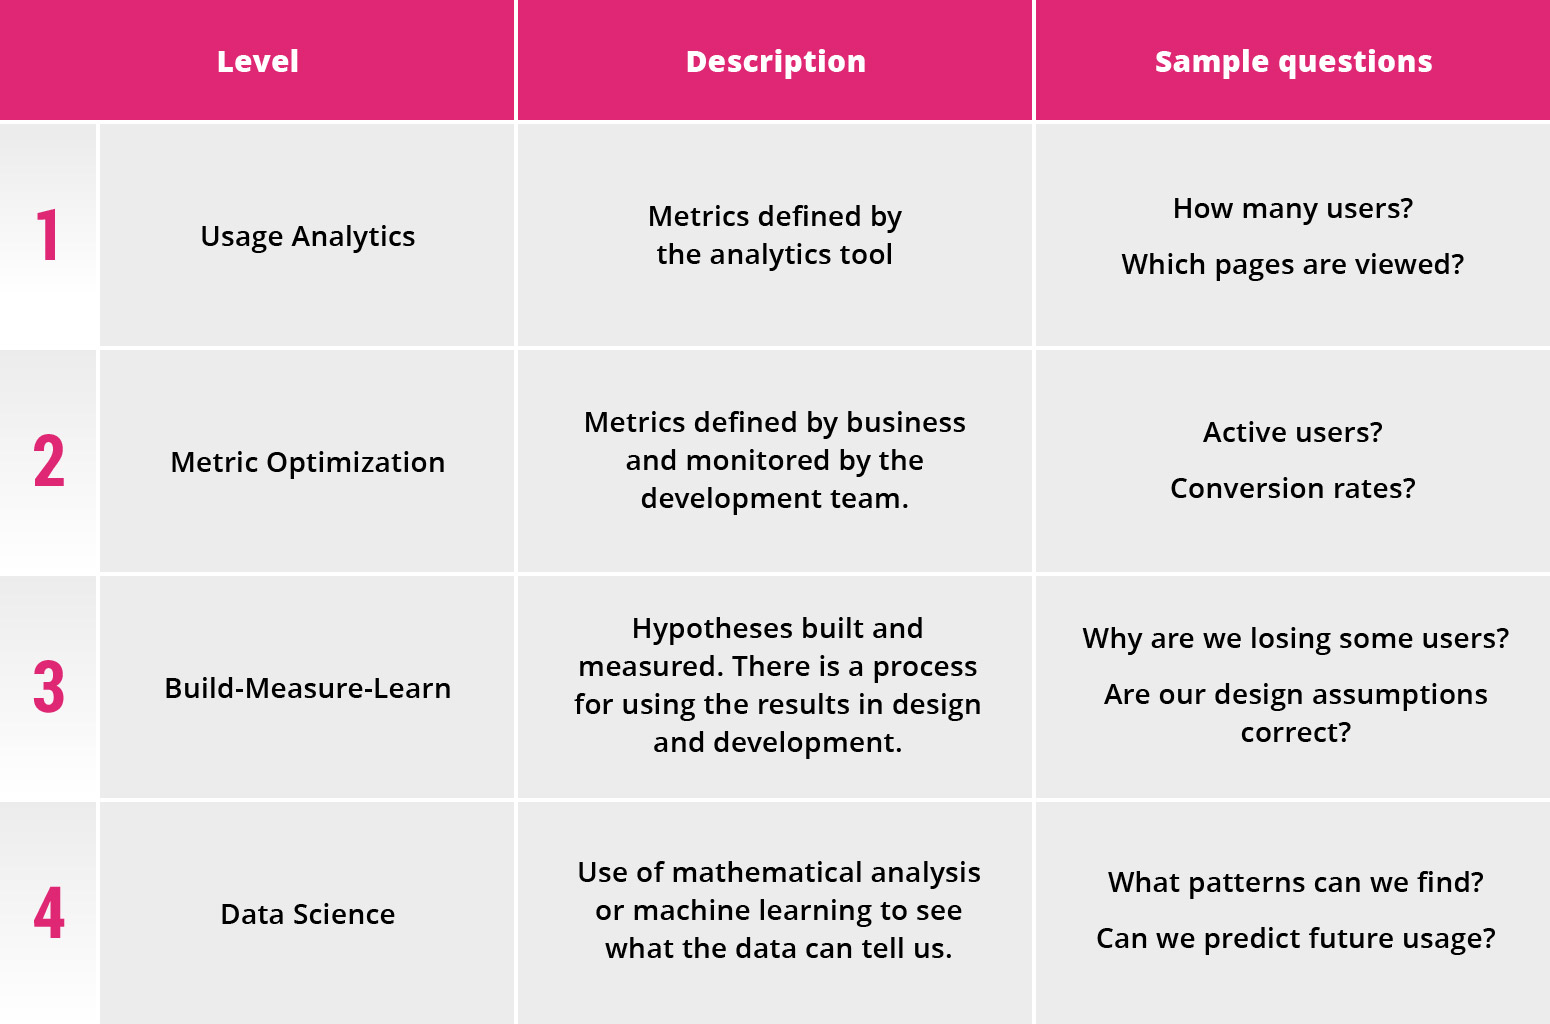
The use of analytics data in design and development processes has evolved a lot during the last few years. Still, there are vast differences in how different organizations and even individual teams do this. Based on our experiences with customers, we have come up with the Data Maturity Model. The idea is to use the model as a basis for discussion on how analytics and data should be handled.
At level 0, a team uses no analytics data in its development process. They might have some vanity metrics like the number of total app downloads. In some cases, these numbers can convince senior management, but they don’t actually tell much: the number of downloads will always look good as it can never go down.
In our experience, when a team starts to utilize data, it needs to start from the lower levels. There are no shortcuts.
Level 1: Usage Analytics
The data journey begins with integrating some analytics SDK into the product: Google Analytics, Firebase, Flurry, you name it. All of these tools give some interesting numbers out of the box, such as the number of unique users. At this level, the analytics are purely descriptive: they say something about what your users do, but nothing about why.
A few years ago, many media companies only measured how many times each article was read. This is a good example of level 1 analytics. These are important figures, but are not exactly helpful in product development. If you have a separate card on your scrum/kanban board saying something like “implement analytics”, you probably are at this level. Metrics and measures are not defined by business needs, but by the tool used. We also call this level “analytics as a user story”.
Level 2: Metric Optimization
At level 2, the development team is aware of the key performance indicators derived from business and measures them continuously. They usually have some kind of dashboard showing KPI’s and how they behave over time.The idea is that every change (new feature, UI change or marketing campaign, for instance) is evaluated against the development of KPI’s after the change. Nevertheless, it is not always clear why a certain KPI changed or did not, and what could be done to fix that.
Level 3: Build-Measure-Learn
At level 3, analytics are really well integrated with design and development processes. Every designer and developer bases their decisions on some hypothesis, whether explicitly documented or not. The idea of level 3 is to always build metrics that will tell whether these assumptions are correct or not.
The development of KPIs is measured at level 2, but at level 3 we try to understand why they behave as they do or, more importantly, why they are not acting like we expected. Another difference is that, at level 2, there is usually no clear process how these indicators actually affect design and development decisions (although they always do, to some extent).
One option for implementing the build-measure-learn loop is to document the hypotheses affecting product decisions in a test card format. For example, a test card for measuring the usability of our onboarding flow could look like this:
We believe that our new onboarding flow activates new users.
To verify that, show onboarding to 50 % of our new users
and measure all onboarding steps and user actions after that.
We are correct if more users in the onboarding flow start watching our content than users with no onboarding.
This kind of A/B testing is an efficient way to learn whether a new feature has the desired impact or not.
Level 4: Data Science
At level 4, we add data science on top of all the analytics. The difference between a data analyst and data scientist is that, where the data analyst tries to find answers to questions asked by business leaders, the data scientist formulates the questions based on what can be seen in the data. Unlike level 3, where we test hypotheses with data, at level 4 we explore the data to gain insights we did not think to ask.
You need a lot of data to gain insights from it. Consequently, data science is not possible before a comprehensive analytics collection process has been built at the lower levels. At this level, analytics data is often combined with data from other sources in some kind of data warehouse.
Data science is all about finding patterns, classifying data, and predicting behaviour based on history. It utilizes both statistical analysis and machine learning. Netflix recognizes the viewing preferences of users and decides what kind of content to produce on that basis. Many marketing automation systems predict when the user is becoming passive and try to activate them by sending an activation message. In the gaming industry, the points at which users quit the game are analyzed to identify possible problems (too hard or dull parts) with the game design, to give just a few examples.


