Data science for (business) dummies
Whether your company is building a new mobile app that’s going to form the basis of your digital business efforts or you are interested in optimizing the workflows of your factory employees, data science can help.

We’re not all natural-born mathematicians. But as business people, it doesn’t hurt to understand if it’s some form of dark arts or just common algebra your own or hired-gun data scientist is proposing as a solution to your business problems.
This article series provides you with a basic understanding of the terms and concepts you will typically encounter when working with data scientists.
Part I: Time-series forecasting
Let’s say we are interested in a phenomenon that develops over time and, moreover, whose evolution we hope to be able to forecast. We could be talking about the stock market, the weather, or even the user flows in your mobile app. The good news is that as soon as we have collected some past data about our phenomenon of interest, we can harness our data analysis tools for the job.
Classical time-series models
We could make use of classical time-series models such as ARIMA (AutoRegressive Integrated Moving Average) or one of its numerous variations. We would be assuming to work with a sequence of random variables that are connected in a model-specific way. Fitting such a model to our data means adjusting the model parameters or their probability distributions so that the data can be seen as a likely realization of this sequence of random variables.
The connection between the variables is typically expressed in terms of lags. It simply means that the variable at time t is influenced by variables at previous times: t-1, t-2, etc. A forecast can then be made one step at a time, based on the values of the model parameters.
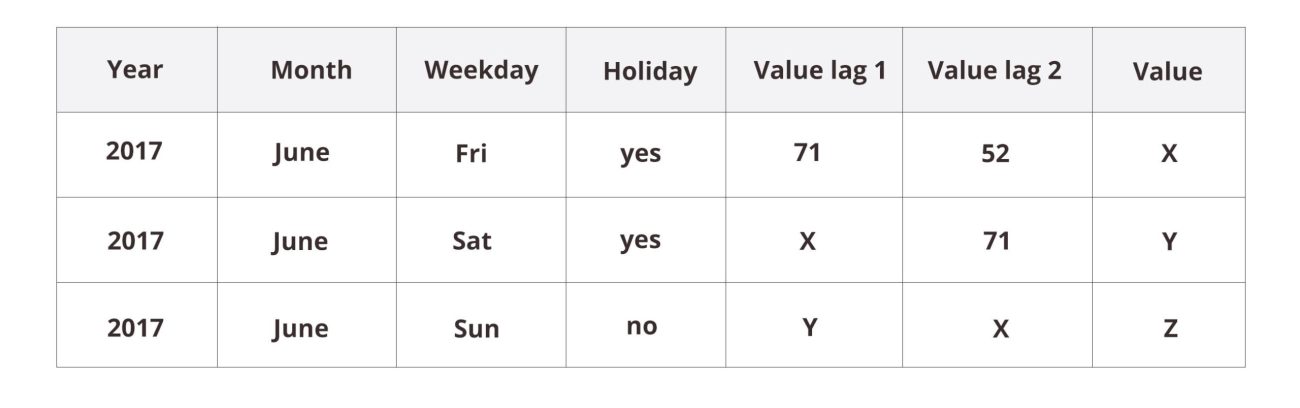
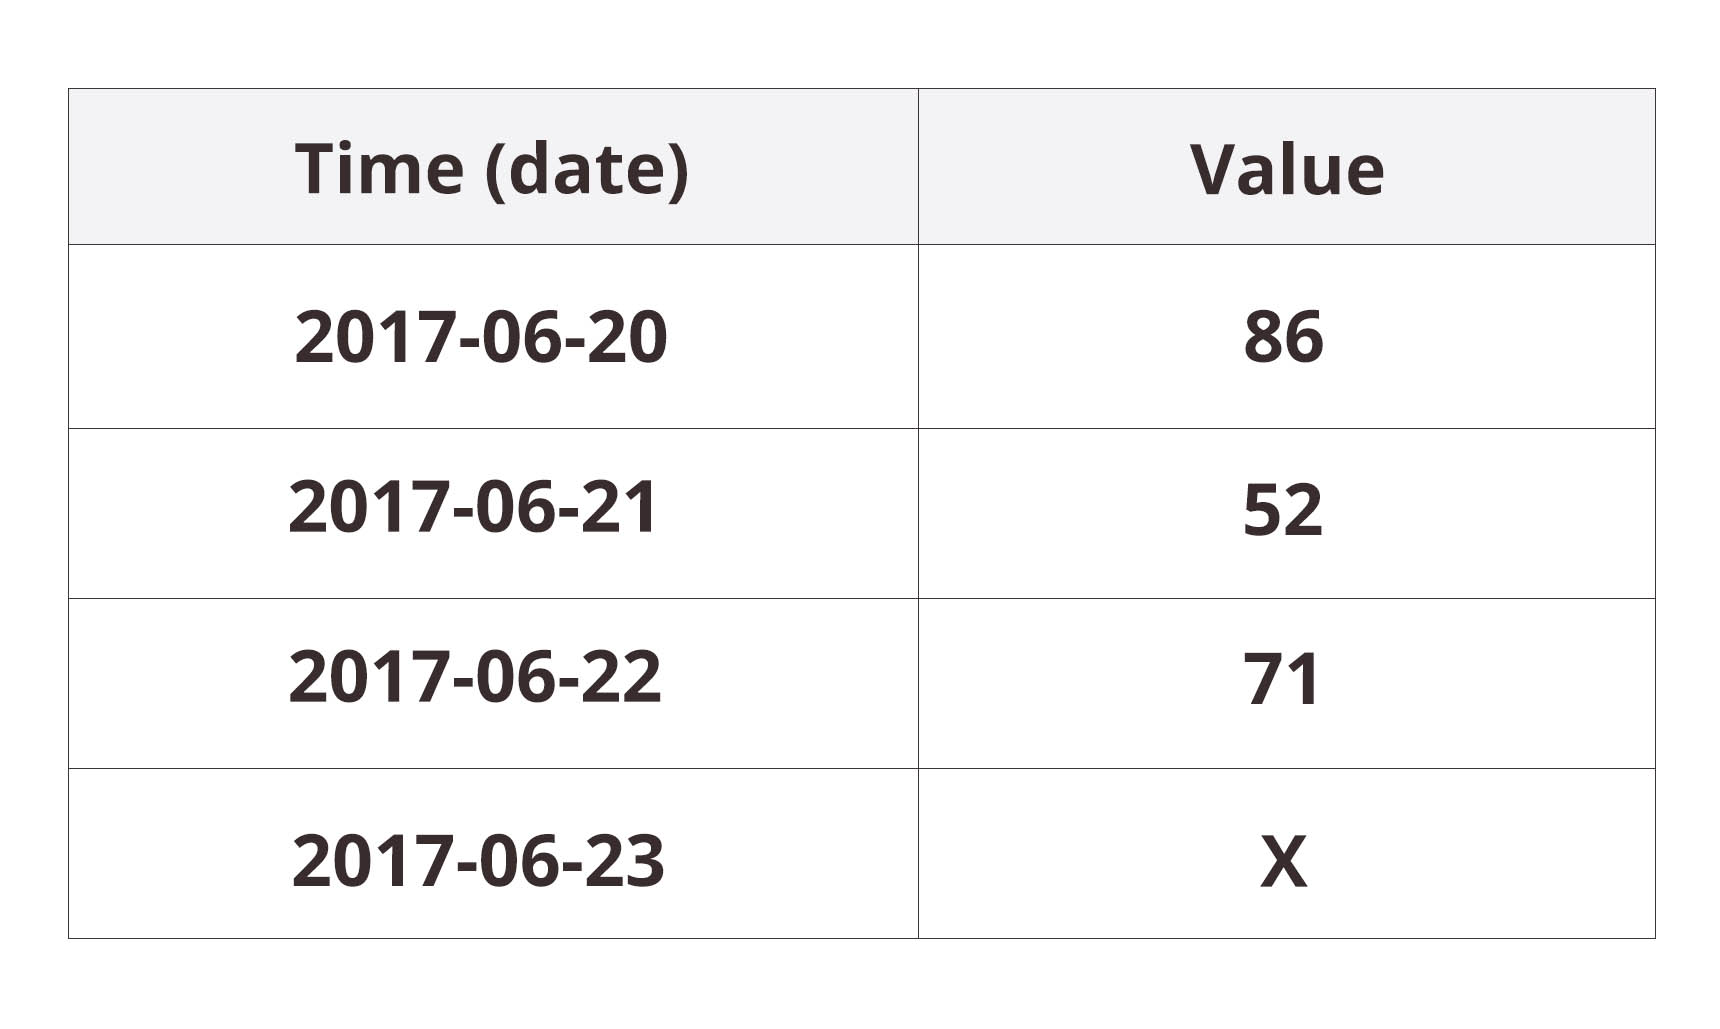
What is the nature of our data in a classical time-series model? Let’s say the last rows of our dataset look like this:
A prediction for the next value, X, would be based on the previous values. If no special information about the upcoming Midsummer’s Eve would be incorporated into the model, the prediction could go drastically wrong. A classical time-series model doesn’t care about our labels for the time steps, it only considers their procession.
A different view of the data
Now let’s take a completely different view of our dataset. Let’s discard the order altogether and see what features can be extracted from the dates. The natural features would surely be the year, month, weekday and, possibly, whether the day is a holiday. The new dataset would look like this:
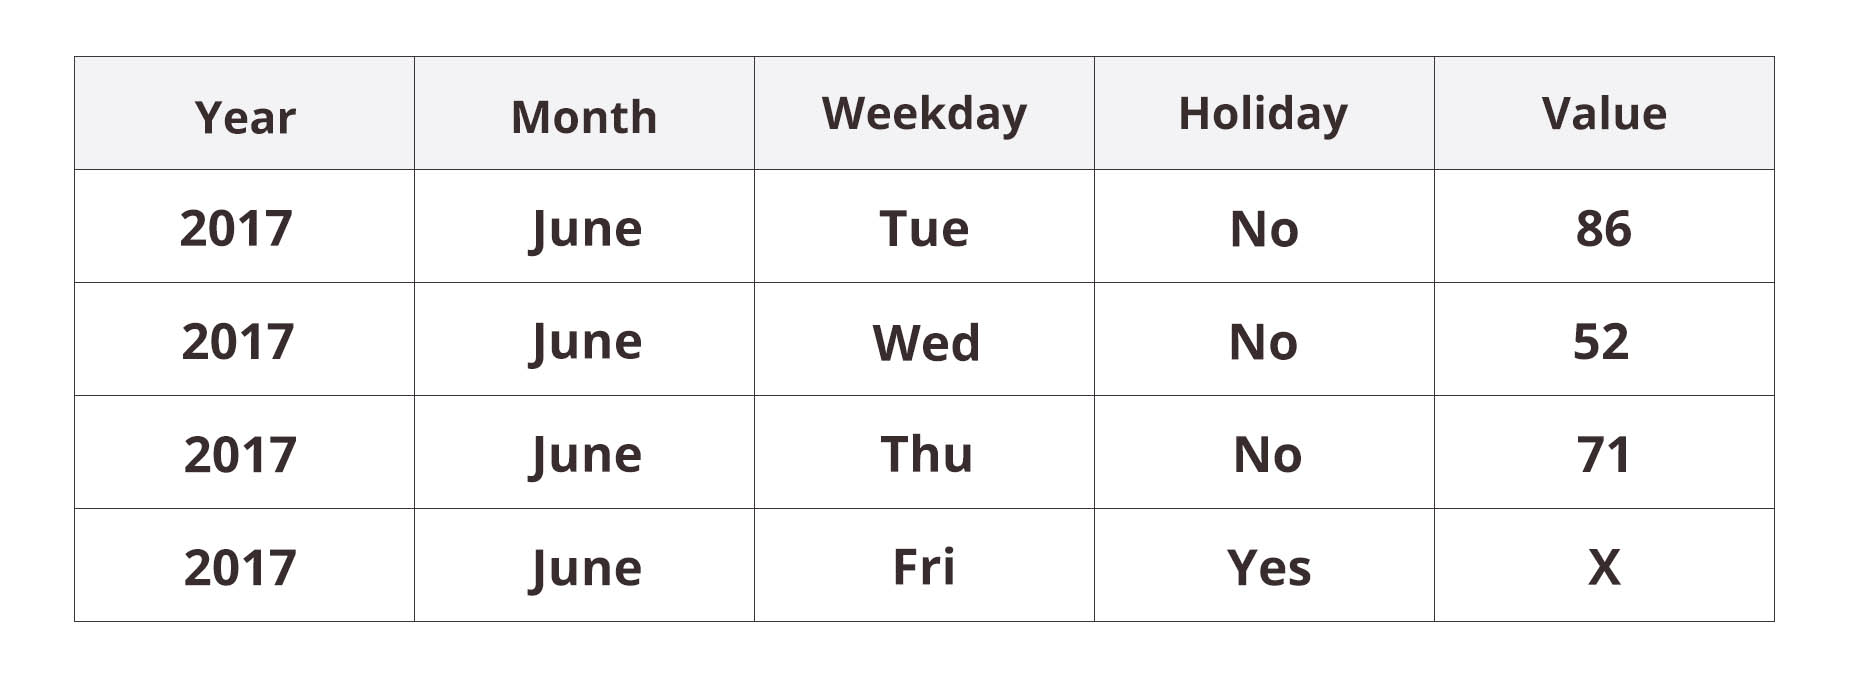
In this form, the dataset can no longer be fed into a classical time-series model. Instead, we could use one of the modern machine-learning approaches, such as random forests or artificial neural networks. These so-called adaptive basis function models are quite flexible as they make no preliminary assumptions on what kinds of patterns they should look for in the data. Rather, they detect the patterns that are present.
Easily imaginable patterns include variation between weekdays and months. Perhaps weekends exhibit different behavior from workdays or summer is different from winter. Or maybe a combined pattern differentiating summer weekends from winter weekends can be detected.
A fundamental difference between the two families of models arises in the processes of fitting and evaluation (i.e. “training” and “testing”). Whereas a time-series model is fitted and evaluated with subsequent time periods, the training and testing sets of a neural network can be arbitrary subsets of the whole dataset. A prediction using a time-series model concerns a given number of days following the current date, while a neural network can make a prediction for any chosen set of dates.
A combination of the two views
In a sense, these are the two extremes when it comes to viewing our data. Whereas the time-series model wasn’t able to grasp the concepts of “weekend” or “summer”, the neural network built on our categorical calendar features will not react to recent, possibly drastic changes in the data. Could we somehow strike a balance between the two?
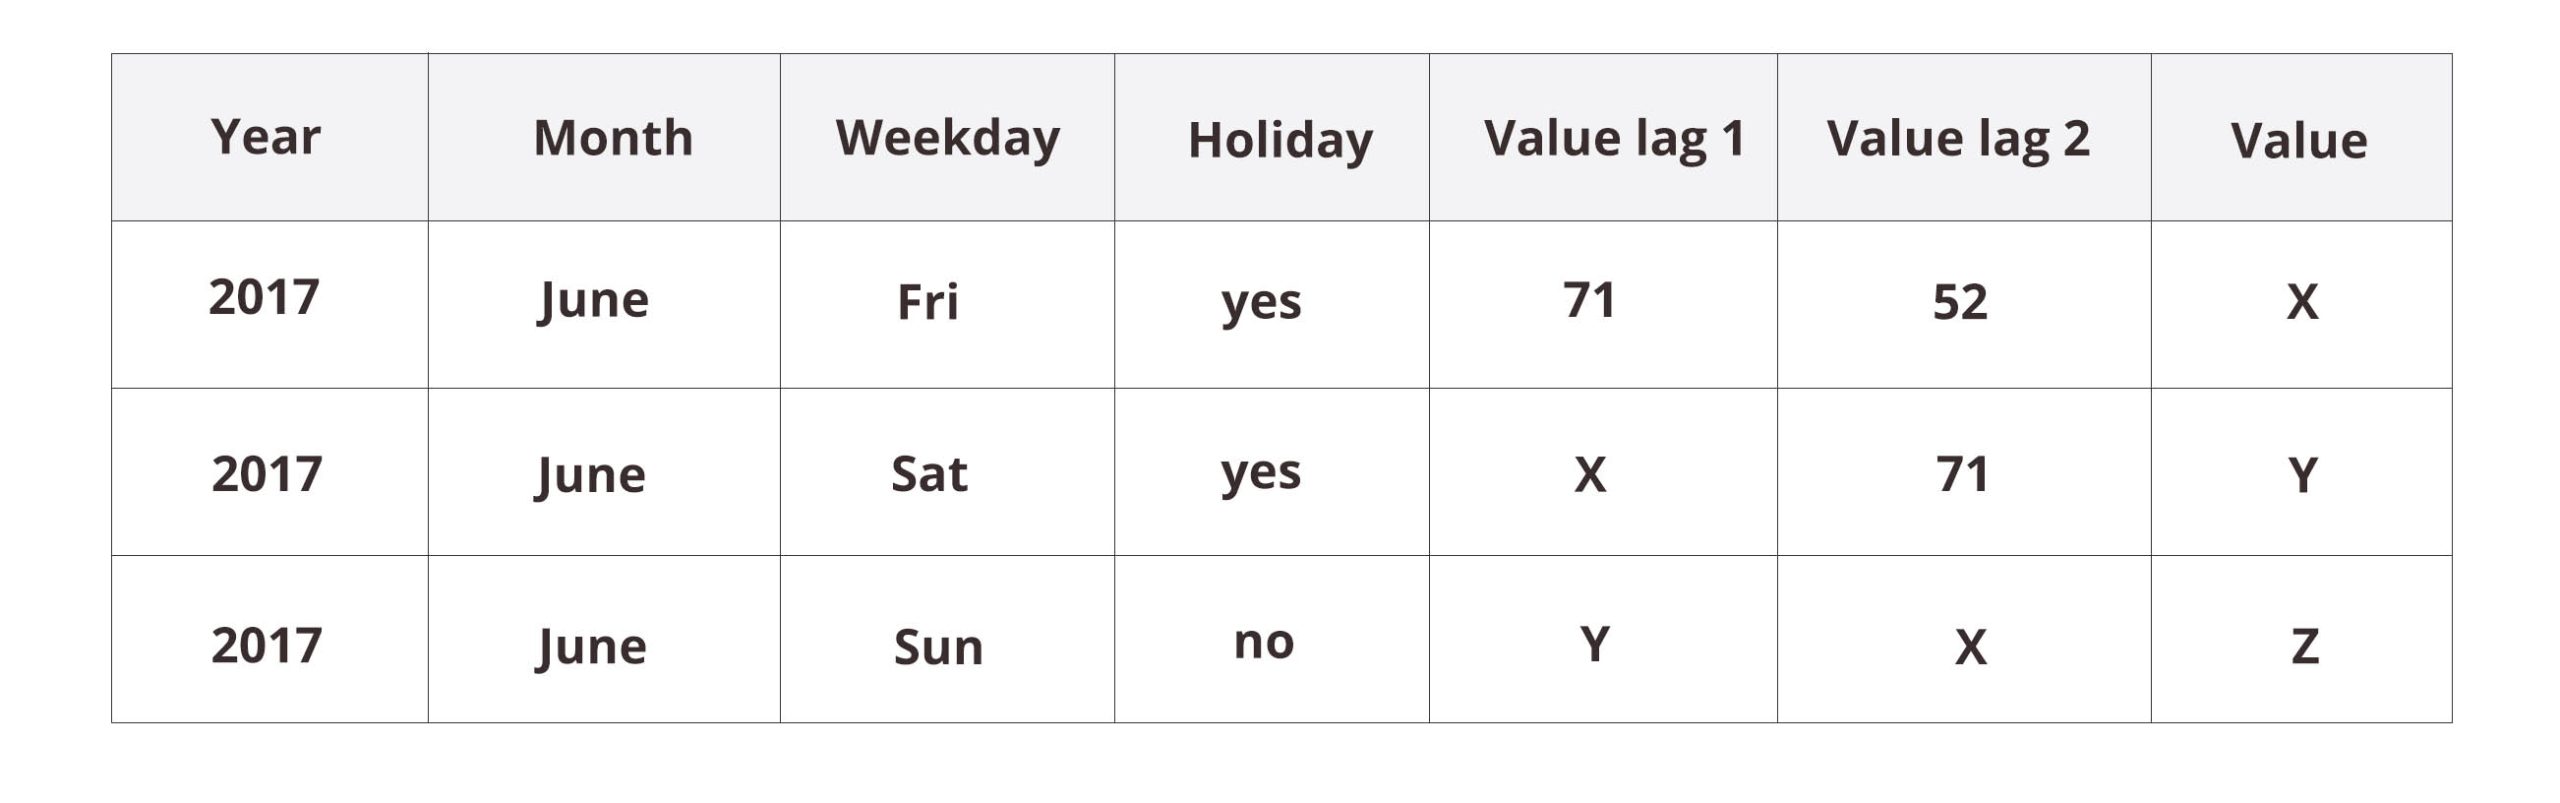
In addition to the categorical calendar features, let’s include a copy of the target (“value”) column with a lag or with multiple lags. This makes sense, because at the time of prediction, we usually have available the data from previous time steps. The dataset would then be rendered into something like this:
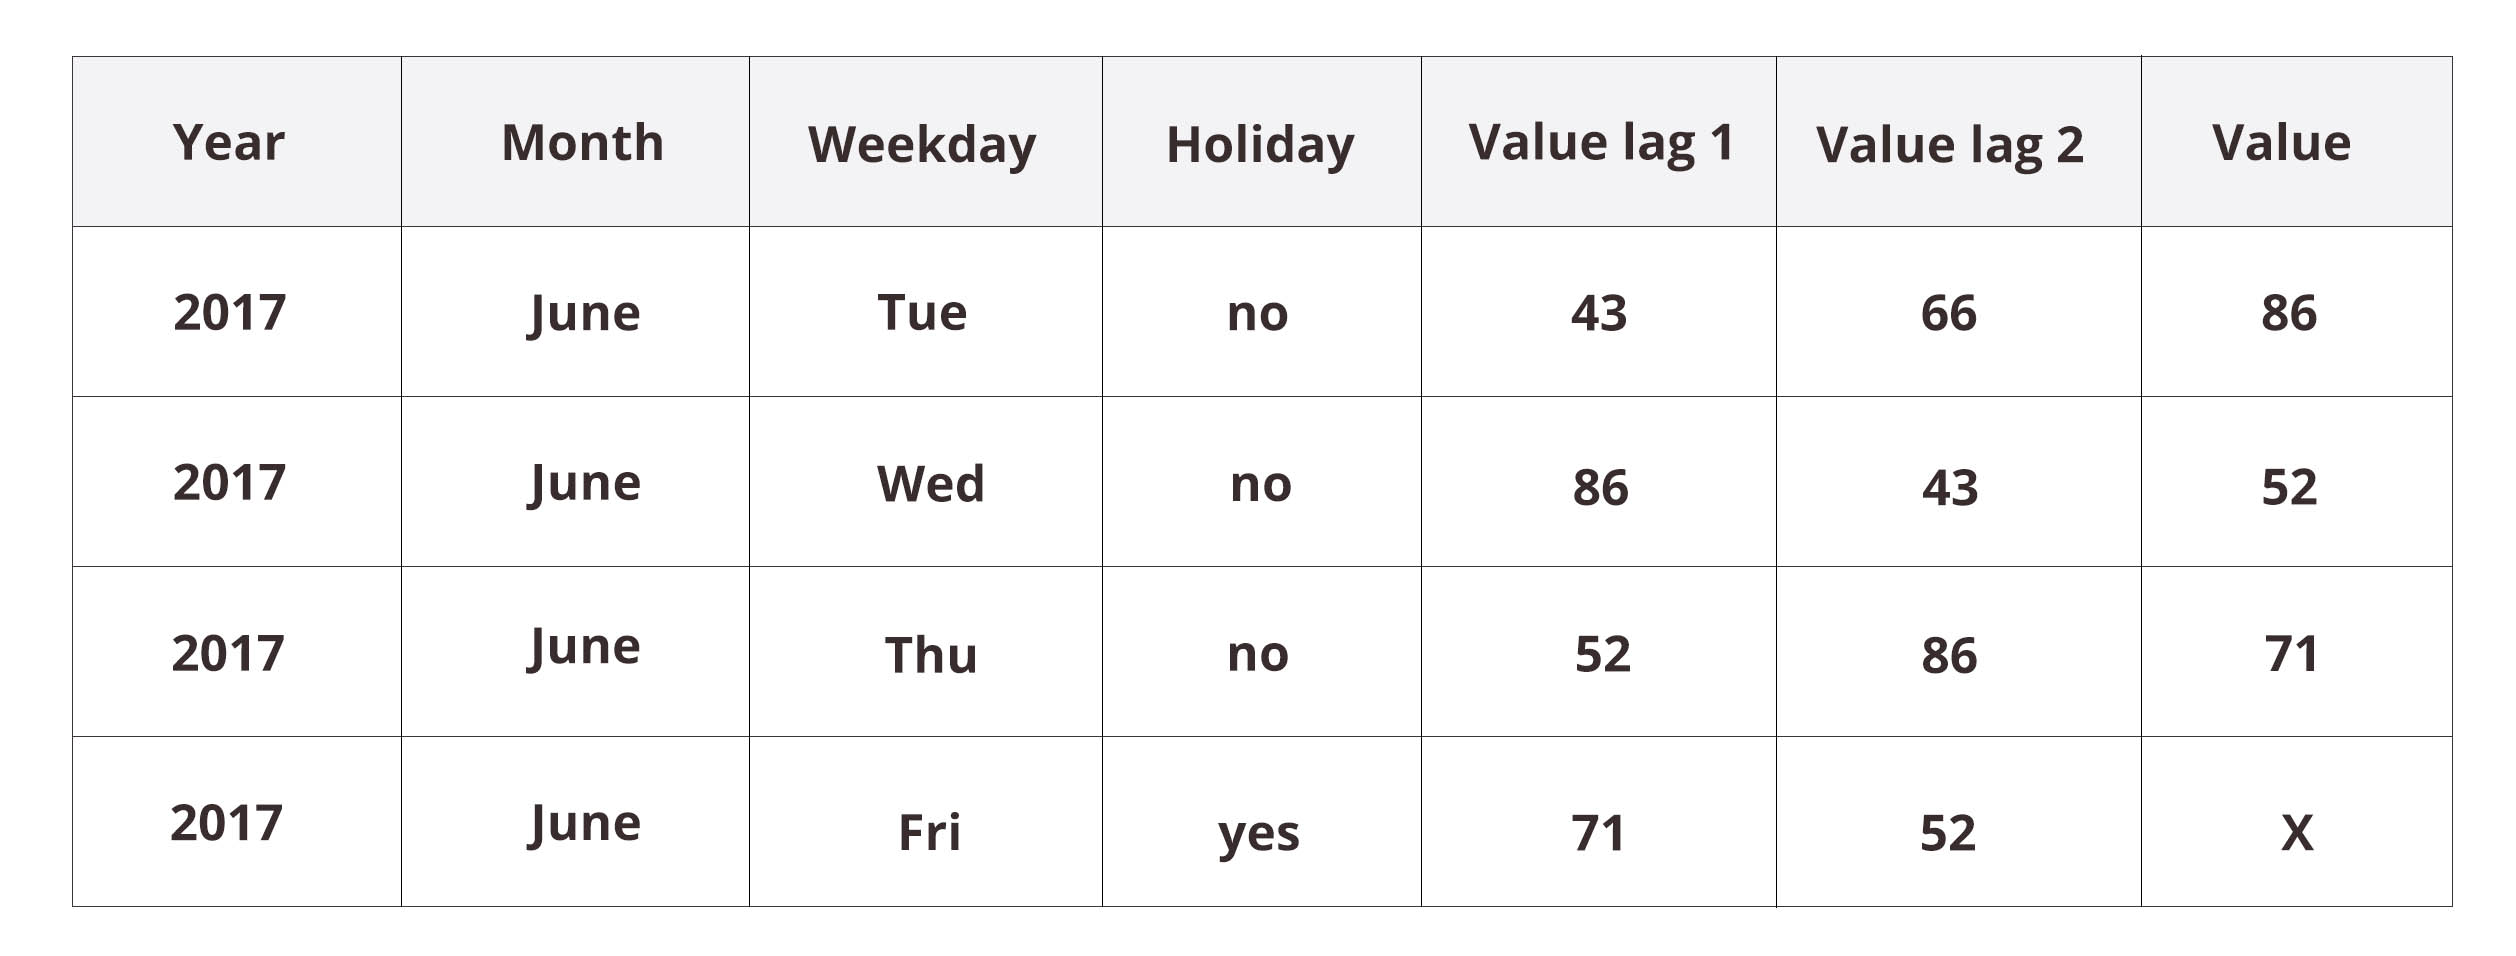
Now, when attempting to predict X we have available the previous value (“value lag 1” = 71) and the one before that (“value lag 2” = 52). This gives the neural network model a possibility to react to recent changes in the data. However, if we are predicting more than just one step ahead, we have to proceed step by step as with the earlier time-series model. Indeed, take a look at the first three rows with unknown values X, Y, and Z:
It is clear that the prediction gets less and less reliable the further we try to predict.
How to choose the model?
Time-series models are great for situations where there is no evident explanation (such as weekdays) for fluctuations, or when the phenomenon has a natural “feedback process”, such as with stock markets. Customer flow, on the other hand, tends to be well explained (at least to some extent) by factors that are easily extracted from the date index.
External data sources
With time-series forecasting, sudden peaks or lows in the phenomenon most often cannot be inferred from past data. To rectify this problem, it is possible to look for external data sources that would correlate with our phenomenon, preferably with some amount of lag. One could try to make use of Google Trends, which provides time-series data on the popularity of different search words in Google searches. It could be that googling with a certain search word would seem to correlate with our phenomenon of interest, with a high search popularity indicating a high target value the day after. It would then make sense to add search popularity as a feature to our dataset. It might allow us to anticipate upcoming peaks that could not otherwise be inferred from our original dataset.
Probabilistic predictions
It is also typical that the phenomenon whose behavior we aim to forecast is inherently random in nature. We cannot hope to be able to make exact predictions with an accuracy close to 100%. Instead, we should content ourselves with aiming for an accuracy that will give us some insight on what to expect. This is in sharp contrast to many machine-learning classification tasks. For instance, the archetypal task of separating images of cats from those of dogs is not inherently random. It’s not random in the sense that the animals in the images are (usually) clearly either cats or dogs. In that respect, the data holds a definite answer to the question.
Acknowledging the random nature of our time-series forecasting task, we should ask for probabilistic predictions. Instead of predicting a single number, we could have a probability distribution over predicted values. Not only does this quantify our uncertainty about the prediction (in terms of credible intervals), but it also paints a wider picture of all possible outcomes. This can be immensely valuable in decision theory.
Let’s elaborate on this latter point. A single number typically summarizes a probability distribution either as the outcome of the most probable event or as the mean value of all possible outcomes. Consider an extreme scenario where a disaster will strike with a probability of 45% and will not with a probability of 55%. An action based on the outcome of the most probable event (i.e. no disaster) is overly optimistic from the point of view of decision theory. If the probability of a disaster is this high, we would surely want to make some preparations.
The utility of probabilistic predictions is not limited to decision-making in extreme scenarios such as the above; they provide us with sufficient information for justified decision-making in numerous everyday situations. As an example in the mobile business, consider the problem of deciding whether to develop feature X or feature Y in a mobile app on the basis of previous usage patterns. There is usually an abundance of arguments for either feature. Only a carefully balanced view based on collected data can give a sufficiently objective viewpoint for our decision.
Do you already have data scientists of your own, or do you hire data scientists as consultants? Do you now feel better equipped to discuss your business problems with them? Let us know by email or share this article on your favorite social media to start a discussion.