
Global mobile trends in 2020 – recap of two reports
In 2019, the world of personal computing grew increasingly mobile, and also increasingly diverse. Two reports published at the brink of the new decade show how people are globally spending an increasing amount of time with their mobile devices, with desktops and tablets both losing users. Enjoy the best parts of the ComScore 2019 and […]

In 2019, the world of personal computing grew increasingly mobile, and also increasingly diverse. Two reports published at the brink of the new decade show how people are globally spending an increasing amount of time with their mobile devices, with desktops and tablets both losing users.
Enjoy the best parts of the ComScore 2019 and AppAnnie 2020 annual reports in this exclusive summary by Qvik.
Mobile applications hog most of the public’s attention
Globally, people spend 3.7 hours every day on their phones. This average is heavily weighted by the huge Chinese consumer base, who are closer to four hours. In countries such as the US, the UK, Canada, or Japan, the daily dose is nevertheless also close to three hours and growing by at least 10% annually (AppAnnie).
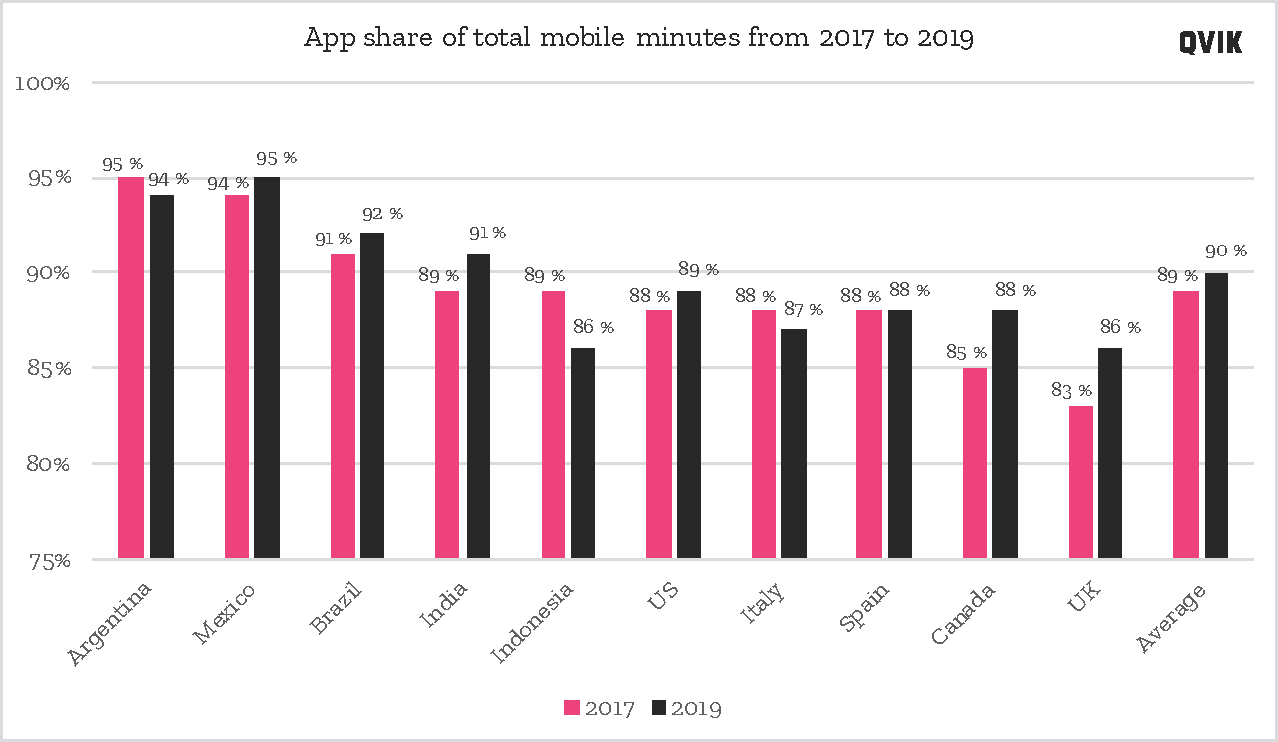
Mobile applications global share of mobile minutes based on ComScore report.
The time spent with mobile apps remains very high. In the ten big countries tracked by ComScore, the average share of mobile minutes spent on apps has remained close to 90% from 2017 to 2019. This leaves only 22 minutes for mobile web browsing.
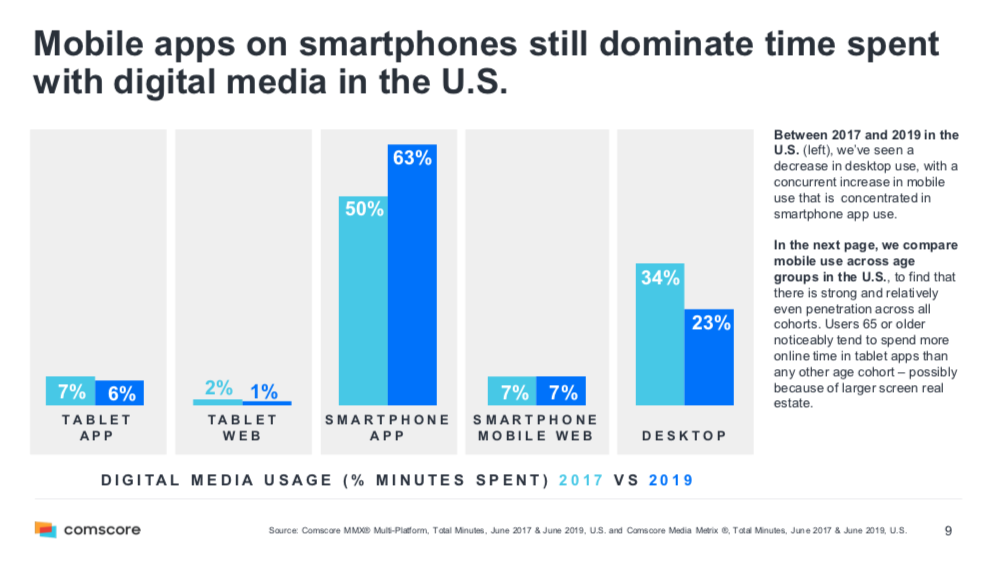
Mobile apps have increased their timeshare from 2017 to 2019 in the U.S. Screenshot from ComScore report.
Finland – same but different
International trend reports usually focus on the biggest global markets and the US. This does not make them irrelevant for smaller countries such as Finland.
Most global trends are also reflected in the Scandinavian market. For instance, Tinder is the most successful app in driving in-app purchases both globally and in Finland.
The Facebook, Google, Netflix, Spotify, and TikTok apps that dominate the global reports also show up in Finland’s Top 10 national charts.
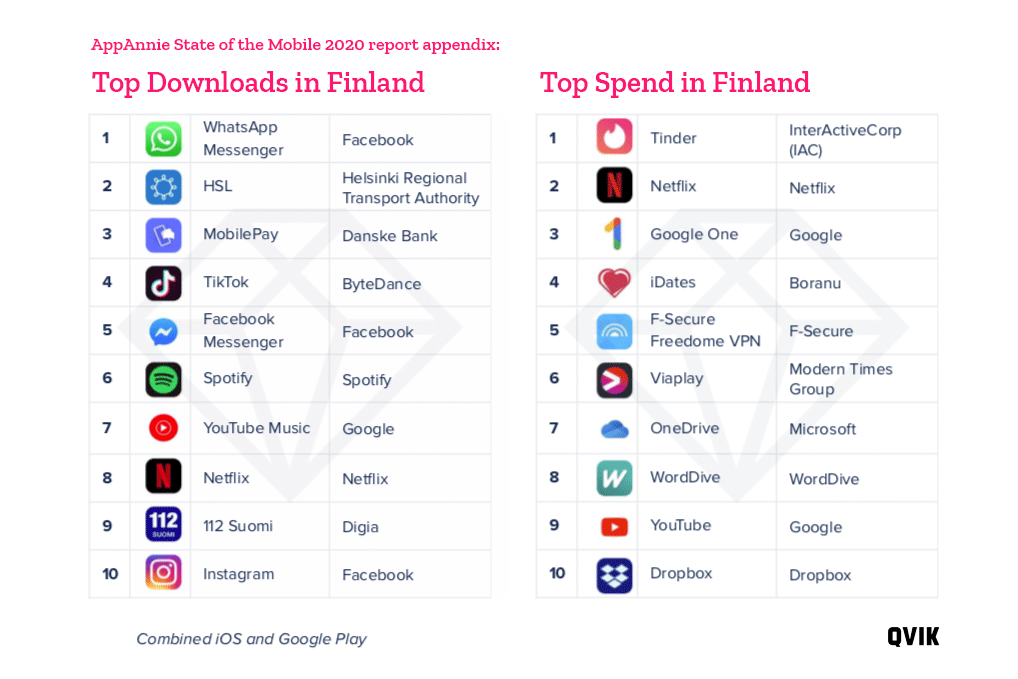
Most downloaded and best monetized mobile apps in Finland according to AppAnnie.
But there are differences, too. For instance, the world of fintech is not (yet) dominated by any single international giant. Instead, most countries have their local trusted brands, such as the MobilePay app prominent in the Finnish Top 10 download list.
Supercell has long been the crown jewel of the Finnish application industry. Based on AppAnnie’s statistics, it is still going strong as both Clash of Clans and Clash Royale are in the Top 10 for numbers of monthly active users. Though they are absent from top downloads, the former still makes it to the Top 10 in consumer spend.
For the sake of Finnish game design, let’s hope Supercell comes up with a new hit game in 2020. At least they still have a very lucrative market position!
Fun, games and gossip – it takes time
What do people do for those whopping three hours spent tapping away at their beloved devices?
Mostly, gaming.
Mobile gaming is a huge thing no matter which way you look at it. Consumer spending on mobile games will exceed all other gaming platforms in 2020. AppAnnie predicts that total consumer cash burnt on games will top 100 billion dollars in 2020.
Casual games, such as arcade and puzzle games, lead the app downloads (82% of downloads), but action and RPG titles account for 55% of players’ time, and 76% of their money. Opposite to what you might expect, gambling and casino games only rack up 6% of the money pile. Of course, with a big pie like that, this small slice still fuels a five billion dollar business.
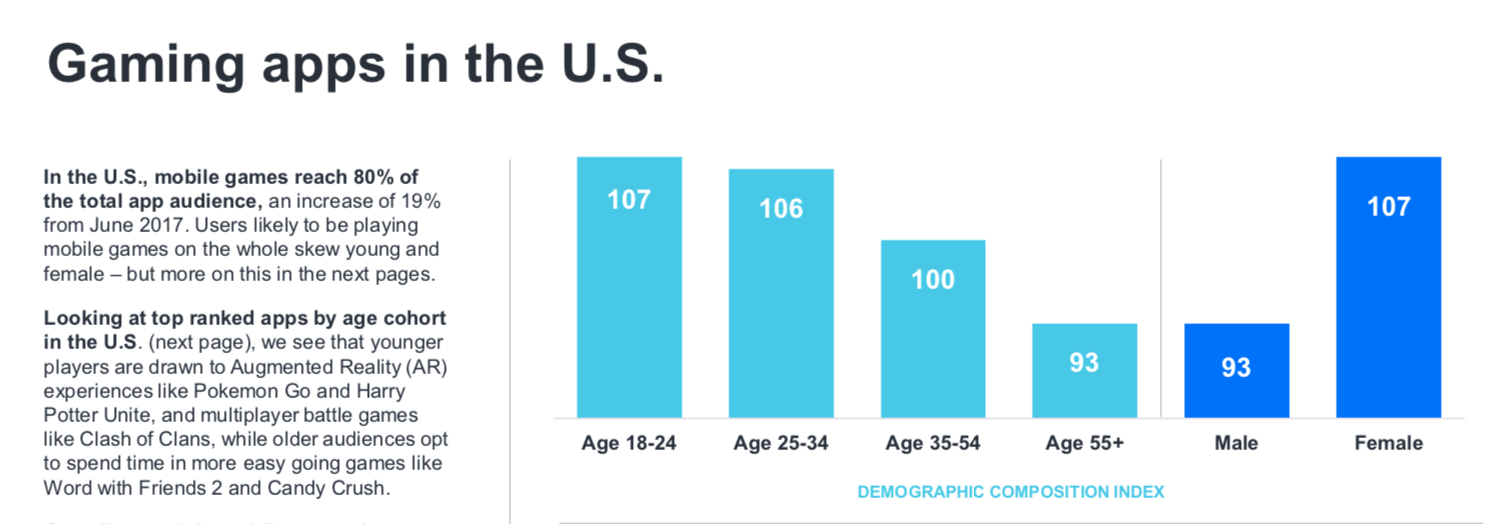
ComScore figure about the US gamer demographics show surprisingly small effect of aging and clear gender difference.
Maybe the most surprising finding in ComScore’s US target group is that ladies play more often than gents. This also holds true for countries such as Canada, Italy, the UK, and Spain.
Another surprise is that “females 55+ spend more time per user playing mobile games than other female age groups” (ComScore, 2019., p. 18). Let’s be clear: the 55+ age bracket is not as active in gaming as people aged 18 to 34, but when they do play, they get hooked.
And no, your grandma or mom is not playing RPGs, but arcades and puzzles. But she may still be spending her money on in-game purchases. Although 75% of all players enjoy free-to-play games, 73% of them have made purchases and only 34% say they enjoy doing buying stuff, rather than feeling compelled to do so.
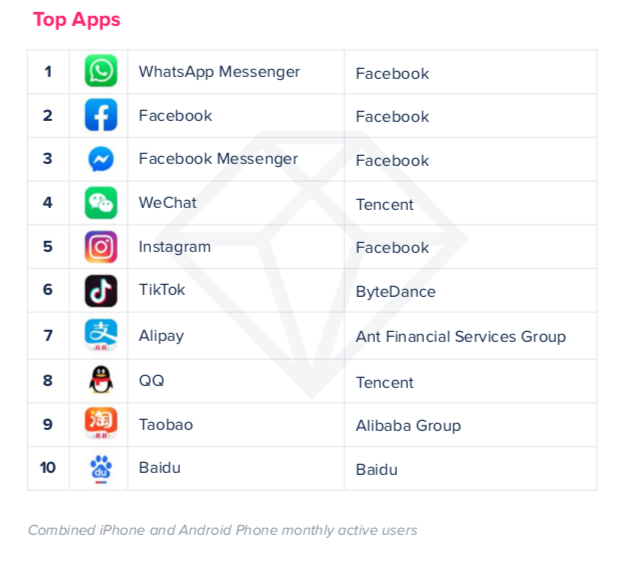
2019 Global Top10 of mobile applications by monthly active users according to AppAnnie.
There are other time consuming apps besides gaming, namely social media. ComScore also lists other app categories that people use almost exclusively on mobile, such as dating, ride sharing, navigation, weather, coupons, and food.
Desktop e-commerce surprises
More time spent on mobiles also means more time shopping. AppAnnie reports that Alibaba’s Singles’ Day inspired $38B in global digital spending in 24 hours. A similarly incredible amount of money, $33B, was spent in the US exclusively on mobile in November 2019.
The current development of e-commerce in the US is surprising in certain respects. It turns out that digital engagement with shops also increases the engagement with physical shops (the bricks-and-clicks model).
“Mobile is a critical avenue for omni-channel growth. It’s not just about converting through the mobile app, it’s about mobile driving research and consideration, and facilitating fulfillment — such as through in-store pickup and tracking of packages.” (AppAnnie, 2020, p. 28)
However, although people spend less time on desktops, their relative importance in digital shopping is currently increasing, at least in the US.
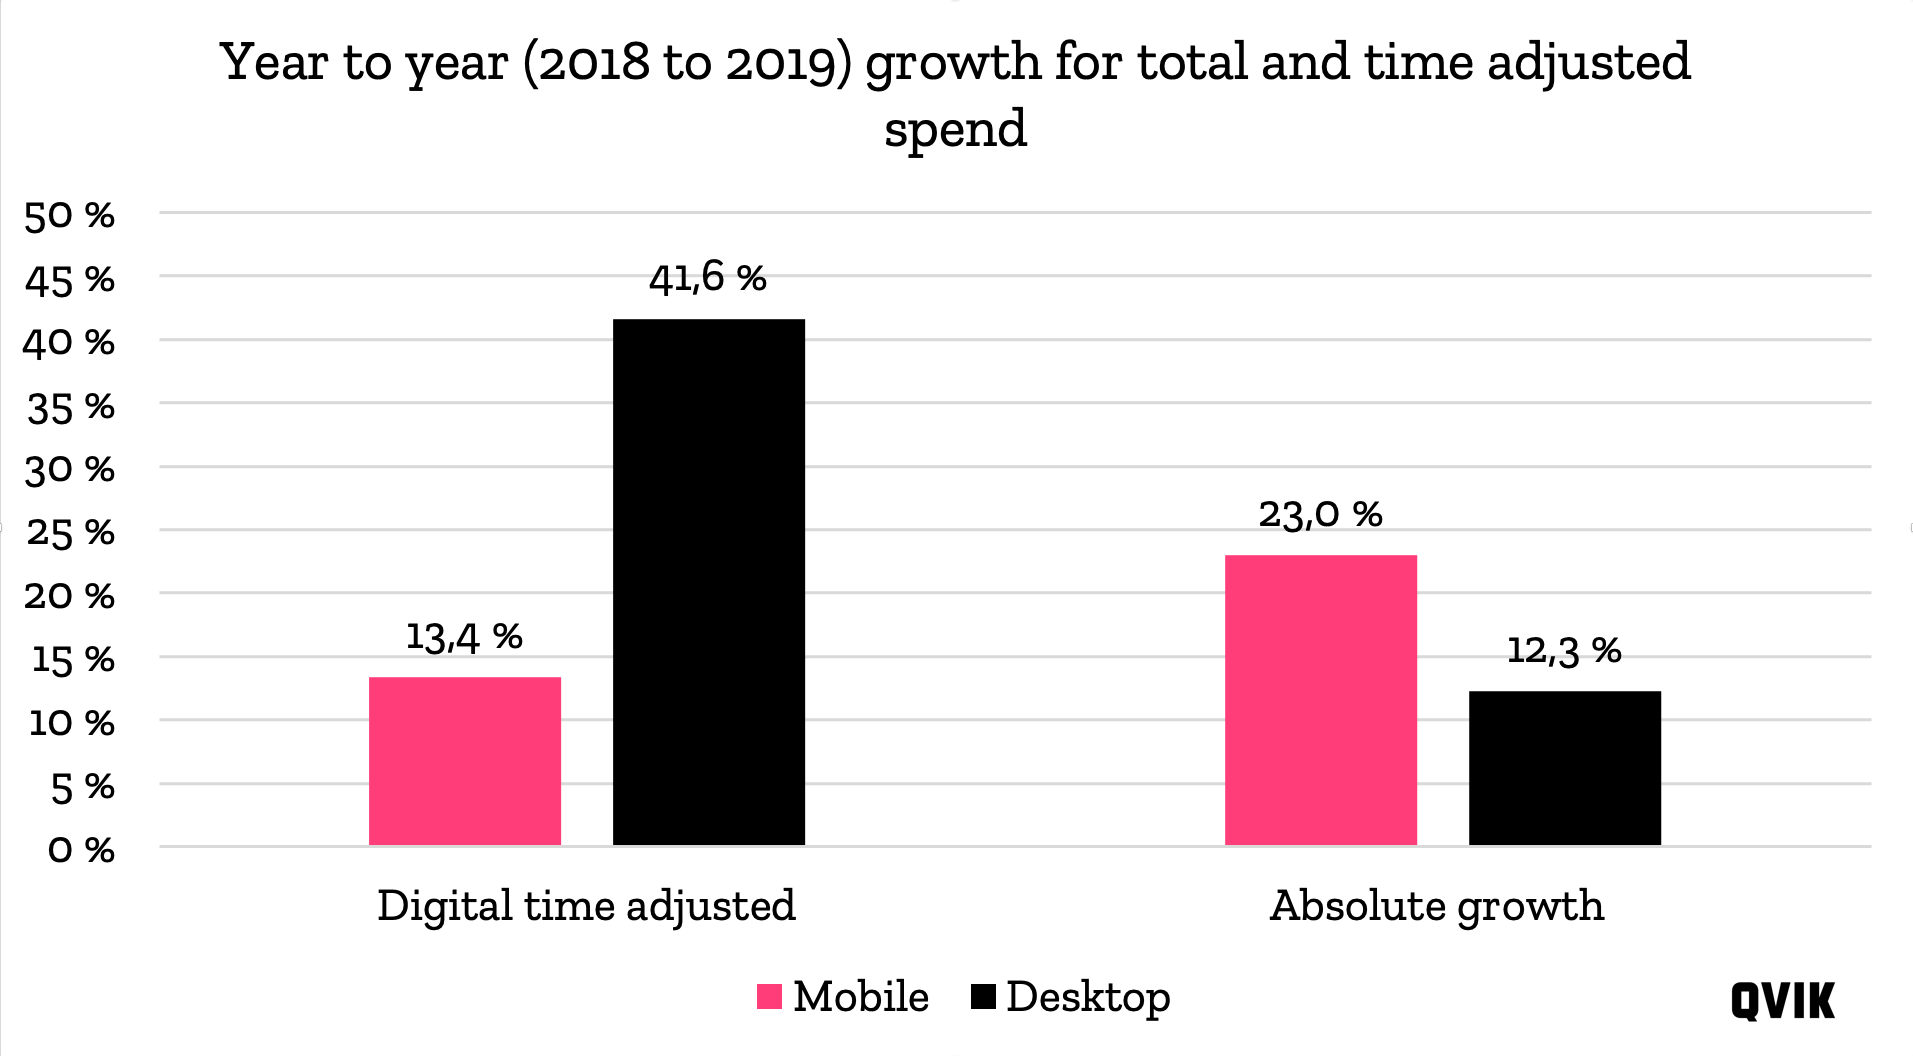
Comparison of mobile and desktop ecommerce change from 2018 to 2019 by adjusting for the media time spend on each type of device.
In our re-calculation of ComScore data, the time-adjusted increase in the growth of desktop e-commerce is 42%, triple that of year-to-year growth in the mobile channel (13%).
Rewarded advertisements on the rise
The mobile advertising business is big. Its value grew from $155B to $190B in just the last year (22%; see AppAnnie, 2019), with a similar leap of around 20% expected in 2020.
That equals $40B more in advertising spend.
This development would bring the revenue generated by mobile ads up to the level of traditional channels, when adjusted by exposure.
Increasing spending on advertisement is visible to consumers in the increasing number of ads everywhere. The most interesting new trend in advertising is pushing ads in exchange for free game play or content access.
In the ComScore survey, over 50% of US gamers said that, even though they normally dislike ads (87% do), they don’t mind them if they get a reward for watching.
Highlights of 2019: rides and deliveries for the rich
Uber dominates the world of ride sharing (with consistently awful financial outcomes so far). ComScore shows that, in the US, ride sharing is much more popular among high-income households ($100,000 or more annual income). The same trend applies to mobile food orders: the rich get their food delivered.
See you next year!
We can expect more insights from ComScore and AppAnnie in the next 12 months. In the meantime, be on the lookout for Internet Trends by Mary Meeker in June 2020.
Read the full reports:
ComScore, Global State of Mobile 2019
https://www.comscore.com/Insights/Press-Releases/2019/12/Comscore-Releases-2019-Global-State-of-Mobile-Report
AppAnnie, State of Mobile 2020
https://www.appannie.com/en/go/state-of-mobile-2020/
Summary: The State of Mobile in 2020
https://s3.amazonaws.com/files.appannie.com/reports/2001_State_of_Mobile_2020_Summary_EN.pdf
Illustration: Aija Malmioja